| Quick Answer Planograms are a retail product placement tool that boost sales by turning shelf space into a structured, data-driven revenue system. They ensure high-margin and high-demand products occupy the positions where shoppers are most likely to see and buy them, trigger impulse purchases through deliberate placement near checkouts and end caps, increase basket size through tested cross-category adjacencies, and reduce lost sales from out-of-stocks through facing-count discipline. When executed correctly and monitored for compliance, planograms consistently produce measurable uplifts in sales per square meter, category conversion rate, and gross margin without requiring a larger marketing budget. |
Most retail stores carry the same or similar products as their competitors. The difference in revenue between a high-performing store and an average one rarely comes from what is on the shelf. It comes from how it is arranged there.
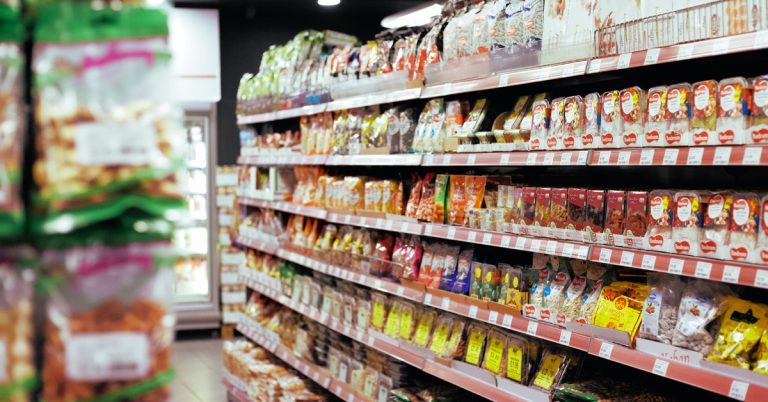
The average shopper spends just 13 seconds choosing a product once they are in front of a shelf. In those 13 seconds, position determines more than price, packaging, or brand reputation. The product that is at eye level, in the right adjacency, with the right facing count gets chosen. The product that is two shelves down, facing a wall, next to an unrelated category does not.
Planograms are the mechanism through which retailers control this. They translate sales data, shopper behavior research, and margin strategy into a specific set of instructions for where every product sits, how many facings it receives, and what surrounds it. When those instructions are followed precisely across every store in a network, the revenue impact is measurable and repeatable.
This guide covers exactly how planograms drive that revenue by position, mechanism and outcome. For an introduction to what planograms are and how to read them, see our planogram fundamentals guide. This blog focuses entirely on the sales impact.
Table of Contents
The Before and After: What Changes When a Retailer Implements Planograms
The clearest way to understand how planograms boost retail sales is to compare the same shelf, same products, and same store, with and without a structured planogram guiding placement.
| Dimension | Without a planogram | With a planogram |
| Product positions | Placed by convenience, vendor relationships, or habit; not by sales performance | Placed by sales data: high-margin items at eye level, complementary items adjacent, impulse products at the journey’s end |
| Eye-level space | Often occupied by whichever product arrived first or was easiest to stock | Reserved for high-margin, high-velocity, or strategically important SKUs that generate maximum return from the premium position |
| Stockouts | Spotted reactively. When a staff member notices or a customer complains | Prevented proactively. Facing counts and replenishment triggers defined in the planogram flag gaps before they lose a sale |
| Cross-sell opportunity | Adjacent products placed by category taxonomy. Related items may be in a different aisle | Complementary products placed adjacent based on basket analysis. Shopper picks up both without searching |
| Space allocation | Space given to products by default or supplier arrangement. Slow movers may occupy more space than fast movers | Space allocated proportionally to sales performance. Fast movers get more facings, slow movers rationalized |
| Consistency across stores | Each store manager decides independently. The same product is in a different position in every location | Identical layout in every store. A shopper who knows where to find a product in one location finds it in the same position everywhere |
| Sales outcome | Revenue determined largely by which products shoppers remember to pick up | Revenue influenced by placement strategy at every aisle, end cap, and checkout. Turning passing shoppers into buyers |
How Planograms Drive Sales: The Specific Mechanisms
Planograms boost retail sales through several distinct mechanisms, each targeting a different point in the shopper’s in-store journey.
1. Eye-Level Placement Converts Browsers to Buyers
The single most valuable decision in any planogram is which products earn the eye-level zone. Eye-level zone is the shelf space between roughly 120 and 170 centimeters from the floor where adult shoppers’ eyes naturally rest. Products placed here can see 20 to 30% higher sales than equivalent products placed on lower shelves. A 2026 peer-reviewed study found that nearly 88% of shoppers focus more on items at eye level. With 47.7% of the shoppers agreeing and 40.1% strongly agreeing that eye-level placement influences their purchase choice.
Without a planogram, the eye-level zone is often occupied by whatever product was easiest to restock or whichever supplier negotiated first. With a planogram, it is occupied by the products that generate the highest return per facing, typically high-margin, high-velocity items or strategic new launches that need maximum exposure to build velocity. Thus, with a planogram the eye-level zone becomes a deliberate revenue tool.

2. End-of-Aisle Displays Generate Sales Uplifts that Rival Price Promotions
Planograms include instructions for end-of-aisle displays. End-of-aisle displays are the perpendicular fixtures at the head of each aisle that are visible from multiple directions and encountered by every shopper who navigates the store.
The sales uplift from a well-executed end-cap planogram can be equivalent to a 4 to 9% price reduction for alcohol categories and 22 to 62% for non-alcoholic products. That is a substantial revenue gain achieved without the margin cost of an actual price cut. The planogram specifies which product occupies the end cap, for how long, with what facing configuration and what promotional signage; converting a generic display into a precision revenue instrument.
3. Checkout Placement Captures Impulse Revenue at the Highest-Conversion Point
Impulse buying accounts for up to 62% of grocery sales revenue and up to 80% in some product categories. The checkout zone is where impulse behavior peaks. Every shopper arrives, waits, and is exposed to whatever the planogram positions in the checkout zone. Products placed near checkouts see a 24.3 to 48% increase in sales compared to the same products positioned elsewhere in the store (Mills Shelving research).
The planogram decides what occupies this premium zone: typically low-cost, high-margin impulse items: confectionery, batteries, travel-size personal care, chilled beverages. Such items will be placed with specific facing counts that keep the display full between replenishments. Without a planogram governing checkout placement, this zone is often filled by whatever surplus stock is nearby.
4. Cross-Category Adjacencies Increase Basket Size
Planograms are built from basket analysis: data on which products shoppers consistently buy together. When the planogram places pasta next to pasta sauce, beer next to snacks, or shampoo next to conditioner, it is reflecting a proven co-purchase relationship.
The sales mechanism is straightforward: a shopper who picks up product A and sees product B immediately adjacent is significantly more likely to add B to their basket than a shopper who would have to go to another aisle to find it. The planogram eliminates the detour, and many shoppers simply do not make the detour on their own. Cross-category adjacency in the planogram converts a single-item purchase into a multi-item basket.
5. Facing Count Discipline Prevents Lost Sales from Stockouts
Retailers lose an estimated $1.2 trillion annually to out-of-stock situations. A significant proportion of these losses are not supply chain failures. The product exists in the stockroom. They are planogram execution failures: the shelf facing is too narrow to hold adequate inventory between replenishments, or there is no visual trigger for staff to identify that a position needs restocking.
Planograms define the minimum facing count for each product based on its sales velocity and replenishment frequency. A fast-selling product with a single facing runs out before the next scheduled replenishment; a planogram-specified three facings holds enough stock to cover the gap. This mechanical relationship between facing count and stockout prevention is one of the most direct ways retail product placement protect revenue that would otherwise be lost to an empty shelf.
6. Space-to-Sales Alignment Maximizes Revenue per Square Meter
Space is a finite resource in any retail store, and every square meter needs to earn its place. Planograms allocate shelf space proportionally to each product’s sales performance and margin contribution. Fast moving products receive more facings, slow movers receive fewer or are rationalized off the shelf entirely.
Without this discipline, shelf space tends to accumulate in the hands of products that hold it by inertia, supplier arrangement, or tradition rather than by performance. The result is slow-moving products occupying premium positions while high-demand products are understocked and chronically out of stock. The planogram corrects this by connecting space allocation to actual revenue data, producing measurable improvement in sales per linear meter across the category.
7. Consistent Execution Across All Stores Compounds the Revenue Impact
In a single-store retailer, planogram impact is local. In a multi-store chain, it compounds. When the same planogram is executed consistently across 50, 100, or 1,000 locations, the revenue uplift from eye-level placement, end-cap strategy, checkout optimization, and cross-category adjacency multiplies by the number of stores where it is correctly applied.
This is the business case that makes planogram investment particularly compelling for retail chains: the cost of developing and maintaining planograms is largely fixed, while the revenue benefit scales with the number of stores that execute them well. A 5% uplift in sales per square meter from better planogram execution across 200 stores is a materially different financial outcome than the same uplift in a single location.
The Compliance Gap: Where Planogram Revenue Is Lost
A planogram that is not executed correctly does not deliver its projected revenue. The gap between the approved planogram and what is actually on the shelf in any given store on any given day is the compliance gap. The compliance gap is where much of the sales potential of retail product placement disappears.
Compliance failures take several forms: products placed in wrong positions, facing counts below the approved minimum, out-of-stock positions not flagged for replenishment, promotional displays not built by the required date, or new planogram instructions not implemented after a range review. Each failure has a direct and quantifiable revenue cost: the planned placement uplift is simply not happening.
Traditional compliance checking relies on periodic store audits by field teams. These capture a point-in-time snapshot and leave gaps of days or weeks between audits during which non-compliance accumulates undetected. Across a large retail estate, the cumulative revenue cost of these gaps is significant.
AI-powered planogram compliance monitoring addresses this by using image recognition to compare actual shelf images against the approved planogram continuously. Deviations are flagged at the SKU and position level – wrong product in slot, facing count below minimum, out-of-stock – and store staff receive a prioritized correction list rather than a general observation that the shelf is not to plan. The result is faster compliance restoration and fewer lost sales between audit cycles. Data Semantics builds this capability directly into retail analytics environments. Read more about the planogram compliance solution.
The Business Outcomes: What Planogram Excellence Delivers by Role
The revenue impact of effective planogram execution reaches different parts of the retail organization in different forms.
| Role | Business outcome from planogram excellence | Business cost of planogram failure |
| Category Manager | Higher sales per linear meter; category conversion rate improvement; evidence base for supplier negotiations on slotting and promotional support | Slow movers holding premium positions; fast movers chronically understocked; promotional funding not translating to shelf visibility |
| Store Manager | Consistent store performance benchmarked against the plan; faster staff training on shelf layout; fewer customer complaints about products not being findable | Staff time wasted on reactive restocking and customer queries; inconsistent presentation creating brand risk across locations |
| Merchandising / Field Team | Clear, specific execution instructions that reduce ambiguity; AI-assisted compliance checking that prioritizes corrections by revenue impact | Manual audit cycles that miss compliance failures between visits; no prioritization mechanism for which deviations matter most |
| Retail Director / CFO | Sales per square meter improvement across the estate; measurable ROI from planogram investment; better margin management through space-to-sales alignment | Revenue left on the table from execution failures that are never quantified; space occupied by low-performing products that should have been rationalized |
| Supplier / Brand Manager | Share of eye-level space proportional to brand’s category contribution; fair adjacency relative to competitors; compliance data to validate promotional investment | Premium shelf positions negotiated and funded but not delivered in execution; competitor taking the eye-level zone by default |
The Planogram ROI Framework: Measuring the Revenue Impact
The business case for planogram investment is built from four measurable revenue contributions. Retailers can calculate each using existing sales and space data.
- Eye-level uplift: identify the products currently displaced from the eye-level zone by lower-performing SKUs. Apply the 20 to 30% average sales uplift from eye-level positioning to those products’ current sales volume. The projected incremental revenue is the baseline value of correcting the eye-level allocation.
- Stockout recovery: calculate the current stockout rate for the top 20 SKUs by velocity. Each stockout event results in either a substitution (lower-margin product) or a lost sale. Correcting facing counts through planogram discipline to reduce stockout frequency captures this revenue directly.
- End-cap and checkout conversion: compare the current sales of products on end caps and checkout placements against their sales in standard shelf positions. The premium from these positions, which can reach 22 to 62% above standard for non-alcoholic products, represents the revenue generated by strategic placement that would be lost if those positions were filled by default rather than by planogram instruction.
- Basket attachment from adjacency: analyze the basket co-occurrence rate for the top complementary product pairs in the category. Calculate the incremental basket value when both are purchased together versus the rate when they are not adjacent and the co-purchase does not happen.
A retail analytics platform that connects planogram data with sales data, compliance scores, and space allocation makes this calculation continuous rather than an annual exercise. The retailer can see at any time which planogram positions are overperforming, which are underperforming, and where a compliance failure is costing a quantifiable amount of revenue per day.
How AI and Analytics Are Making Planogram Execution More Precise
The discipline of planogram management is being transformed by AI and retail analytics. Three specific capabilities are changing how planograms are designed, executed, and measured.
- Image recognition for continuous compliance monitoring: AI models trained on shelf imagery detect deviations from the approved planogram at the SKU and position level, in near real time. Store staff receive specific correction instructions rather than a general audit report, reducing the time between non-compliance and correction from days to hours.
- Demand-driven planogram optimization: machine learning applied to sales data, basket analysis, and footfall patterns identifies which planogram elements are generating the highest returns and flags where reallocation of space or adjacency changes would improve performance. Planogram updates are informed by live trading data rather than waiting for a quarterly category review.
- Compliance-to-revenue attribution: by linking compliance scores at the position level to sales outcomes, retailers can calculate the revenue cost of specific compliance failures rather than treating non-compliance as a process problem. A planogram position with 60% compliance that generates 40% of the category’s planned revenue from that zone is a quantified loss, not an abstract audit observation.
Explore Retail Automation Solutions from Data Semantics
How Data Semantics Connects Planograms to Measurable Revenue Outcomes
Data Semantics builds the analytics and AI infrastructure that closes the gap between planogram strategy and shelf execution and makes the revenue impact of that execution visible and measurable.
- AI planogram compliance monitoring: image recognition that compares shelf reality against the approved planogram and flags deviations at the SKU and position level across the store estate.
- Retail analytics and shelf performance dashboards: Power BI dashboards that connect sales data to planogram data, giving category managers and retail directors visibility into which positions, adjacencies, and space allocations are generating the highest returns per facing. Explore retail analytics.
- Advanced analytics for basket and space optimization: basket co-occurrence analysis, footfall heatmapping, and sales-per-linear-meter modelling that informs planogram design decisions with live trading data rather than historical convention. Explore advanced analytics.
Also Read: Streamlining Your Shelf with Retail Planogram Software
Conclusion
Every retailer has the same 13 seconds to make an impression when a shopper stands in front of a shelf. Planograms are the tool that ensures those 13 seconds work in the retailer’s favor, by guaranteeing that the right product is in the right position, with the right facing count, next to the right adjacent product, every day, in every store.
The revenue case is clear: planograms produce measurable, repeatable sales uplifts across every element of the in-store journey. The business discipline required to realize that revenue is equally clear: planograms must be executed with precision, monitored for compliance continuously, and updated from live sales data rather than periodic category reviews. Retailers who treat planogram management as an operational discipline rather than a periodic planning exercise consistently outperform those who do not.
Contact Data Semantics to discuss how retail product placement and analytics can be connected across your retail estate.
Frequently Asked Questions
By how much can a planogram actually increase sales?
The impact depends on the category and the quality of execution, but the evidence is consistent and substantial. Eye-level positioning produces 20 to 30% higher sales than below-eye-level placement. End-of-aisle display can produce a sales uplift equivalent to a 22 to 62% price reduction for non-alcoholic products. Products positioned near checkouts see 24.3 to 48% higher sales from impulse conversion. When these position uplifts compound across an entire store the total revenue impact is significant. The variable that most determines whether these uplifts materialize is compliance: how accurately the planogram is executed on the shelf.
Do planograms help with inventory management as well as sales?
Yes, and the two are directly connected. A planogram specifies the facing count for each product (the number of units visible on the shelf) based on the product’s sales velocity and the replenishment cycle. Getting the facing count right means the shelf holds enough stock between replenishments to prevent stockouts, which directly prevents lost sales. Retailers lose an estimated $1.2 trillion annually to out-of-stock situations; a material proportion of these are facing-count failures rather than supply chain failures. Planograms solve both the revenue and the inventory problem simultaneously by aligning space allocation with actual demand.
What is planogram compliance and how does it affect revenue?
Planogram compliance is the degree to which the actual shelf in a store matches the approved planogram. A well-designed planogram that is not executed correctly does not deliver its projected sales lift. If the product assigned to the eye-level, high-conversion position is actually sitting two shelves down because a staff member restocked it in the wrong slot, the planned revenue from that position is lost. Compliance failures accumulate across positions, stores, and days; making the total revenue cost significant even when individual deviations seem minor. AI-powered compliance monitoring detects these failures in near real time and generates specific correction instructions, reducing the gap between deviation and restoration.
Can a small or single-location retailer benefit from planograms?
Yes. The principles that drive planogram sales impact: eye-level positioning for high-margin products, impulse placement at checkouts, complementary adjacencies, facing count matched to velocity – apply at any scale. A single-store retailer using even a basic planogram approach will consistently outperform one relying on intuition or habit for shelf decisions. The investment in planogram development is proportionally smaller for a single location, and the revenue return from better placement is immediate. For multi-store retailers the case is stronger still, because consistent execution across the estate compounds the individual store uplift.